Deep-Assisted High Resolution Binocular Stereo Depth Reconstruction
Deep-Assisted High Resolution Binocular Stereo Depth Reconstruction
Authors: Yaoyu Hu, Weikun Zhen, and Sebastian Scherer.
This is the project page of Deep-Assisted High Resolution Binocular Stereo Depth Reconstruction.
1 Detailed comparison among PSMNU, SGBM, SGBMUR0, and SBMP on Middlebury dataset
Here we list the comparisons between PSMNU, SGBM, SGBMUR, and SGBMP on Middleburry Evaluation V3 with the training cases in their full resolution.
In the following materials, the abbreviation GTC means Ground Truth Coverage, it is the percentage of pixels which have un-occluded true disparities. Middlebury dataset does not provide disparities for all of the pixels in the left image. Some pixels are occluded and some pixels have Inf. disparities. GTCs are different across the cases. All pixels that are NOT covered by the ground truth will NOT participate in the calculation of Bad1.0, invalid, avgErr, and stdErr.
The disparity ranges are determined by looking at the true disparity first. Then a total number of disparity dividable by 8 is chosen. Disparity ranges are converted to minDisparity and numDisparity for SGBM, SGBMUR, and SGBMP. All of the true disparities are confined by the disparity ranges.
SGBM has the lowest Bad1.0 among all the cases. This is because SGBM invalidates lots of pixels and only keeps the pixels which it has ‘confident’ about. The same reason leads to SGMB’s high invalid value.
To compare the performance, we have to consider all the metrics together rather than comparing only one of them. The goal of SGBMP is achieving low avgErr and low invalid at the same time and do its job on our 4K stereo images. Due to the intrinsic difficultis in the hard regions for stereo reconstruction, disparity predictions by SGBMP in SGBM’s invalid regions contains additional noise, making the Bad1.0 value higher than SGBM. The increased Bad1.0 is the cost SGBMP paid to have lower invalid. However, SGBMP manages to achieve lower avgErr, lower invalid, and lower stdErr for most of the cases, meaning it does perform better than SGBM.
The 12 cases on which SGBMP has lowest stdErr are: Adirondack, ArtL, Jadeplant*, Motorcycle*, MotorcycleE, PianoL, Pipes, Playroom, Playtable, PlaytableP, Shelves, and Teddy. The cases marked by * are those SGBMP did not get the lowest avgErr.
Adirondack, GTC 91%, disparity range 1-304 pixels
| Method | Bad1.0 | invalid | avgErr | stdErr |
|---|---|---|---|---|
| PSMNU | 20.92 | (7.52) | 1.18 | 4.81 |
| SGBM | 21.59 | 31.60 | 9.54 | 30.54 |
| SGBMUR | 32.40 | 18.85 | 14.17 | 37.71 |
| SGBMP | 24.82 | 8.47 | 1.10 | 3.61 |
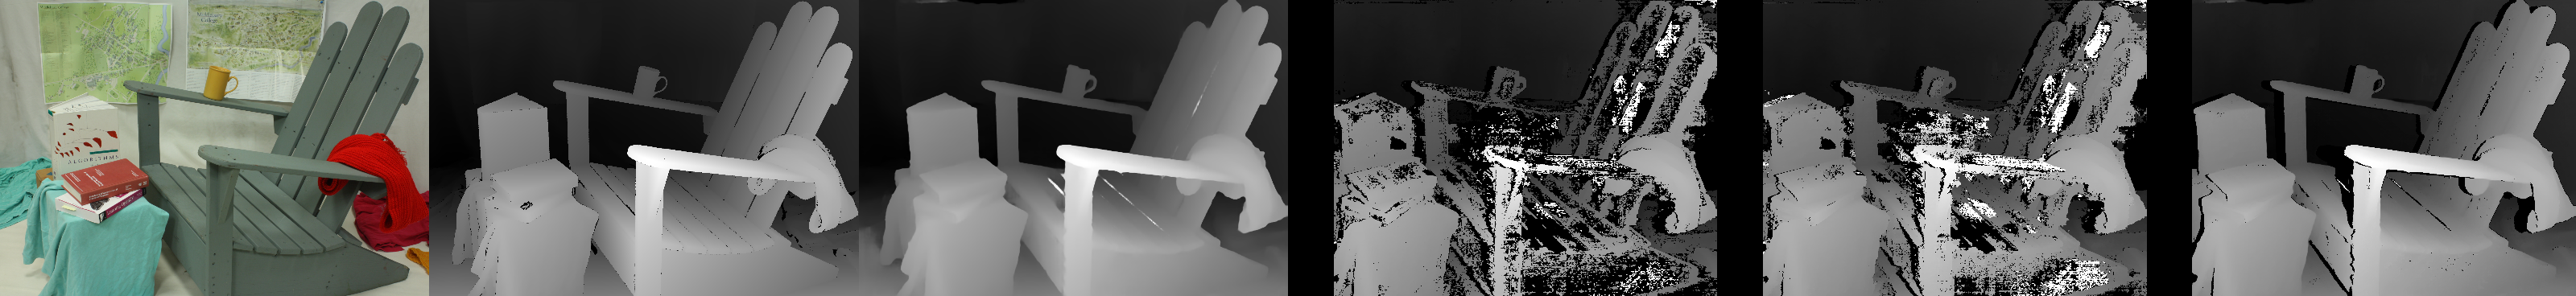
Adirondack, true disparity, PSMNU (up-sampled), SGBM, SGBMUR, SGBMP.
ArtL, GTC 76%, disparity range 1-256 pixels
| Method | Bad1.0 | invalid | avgErr | stdErr |
|---|---|---|---|---|
| PSMNU | 14.77 | (9.25) | 2.94 | 10.34 |
| SGBM | 9.05 | 25.00 | 4.50 | 17.89 |
| SGBMUR | 12.87 | 18.96 | 6.92 | 24.18 |
| SGBMP | 11.52 | 13.44 | 1.78 | 7.63 |
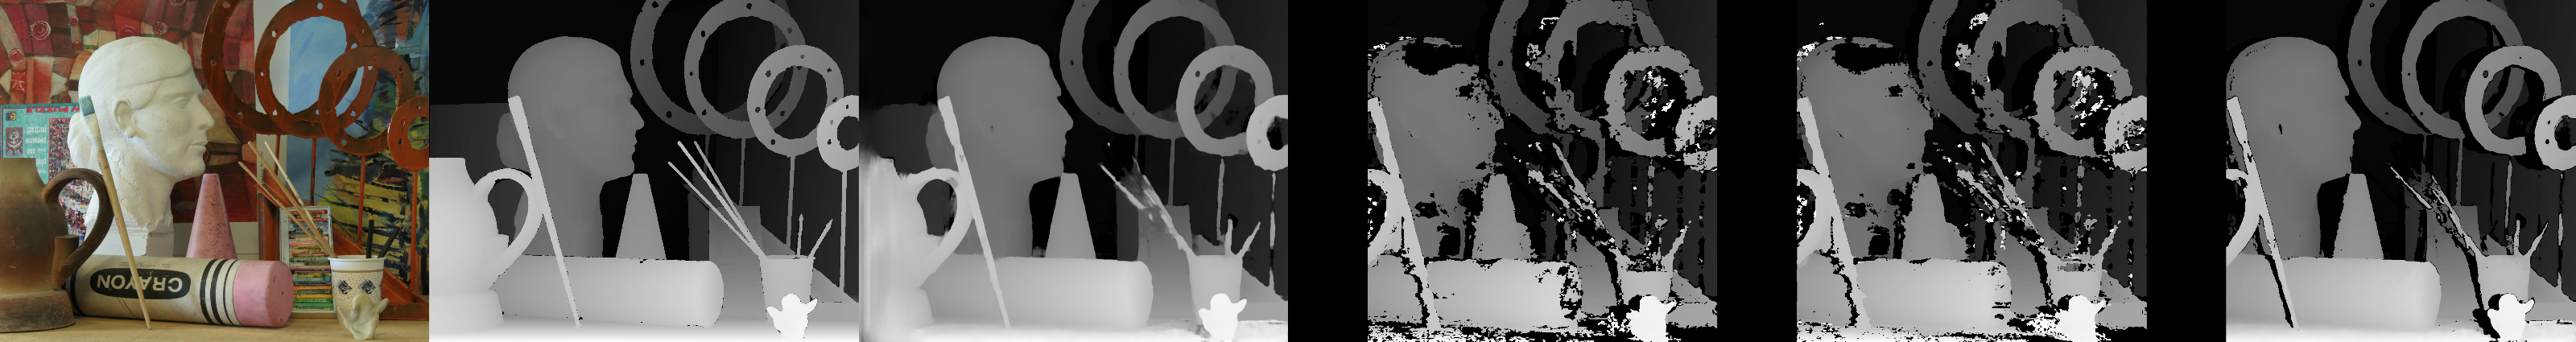
ArtL, true disparity, PSMNU (up-sampled), SGBM, SGBMUR, SGBMP.
Jadeplant, GTC 74.3%, disparity range 1-640 pixels
| Method | Bad1.0 | invalid | avgErr | stdErr |
|---|---|---|---|---|
| PSMNU | 35.09 | (19.35) | 18.29 | 54.90 |
| SGBM | 13.90 | 34.26 | 7.54 | 37.45 |
| SGBMUR | 19.61 | 27.29 | 11.62 | 46.53 |
| SGBMP | 26.11 | 28.23 | 7.84 | 35.74 |
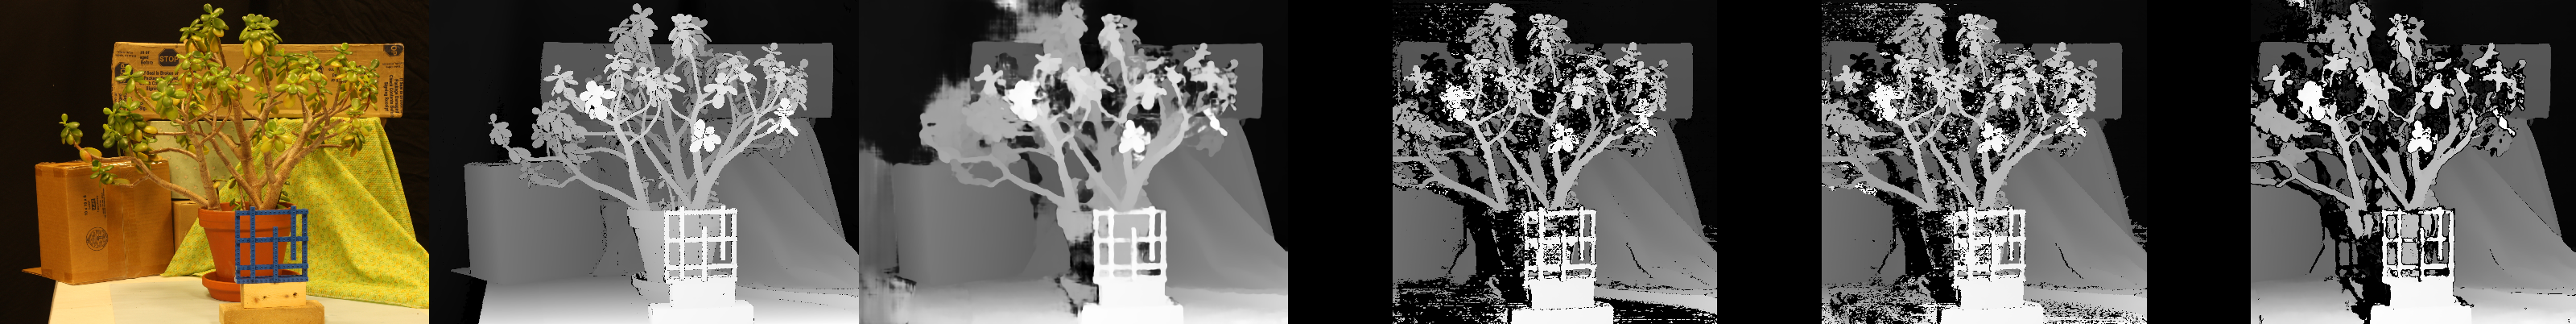
Jadeplant, true disparity, PSMNU (up-sampled), SGBM, SGBMUR, SGBMP.
Motorcycle, GTC 86%, disparity range 1-288 pixels
| Method | Bad1.0 | invalid | avgErr | stdErr |
|---|---|---|---|---|
| PSMNU | 29.11 | (6.28) | 2.95 | 11.64 |
| SGBM | 17.68 | 13.81 | 1.95 | 9.91 |
| SGBMUR | 20.21 | 9.24 | 2.35 | 11.30 |
| SGBMP | 27.65 | 8.44 | 2.09 | 8.69 |
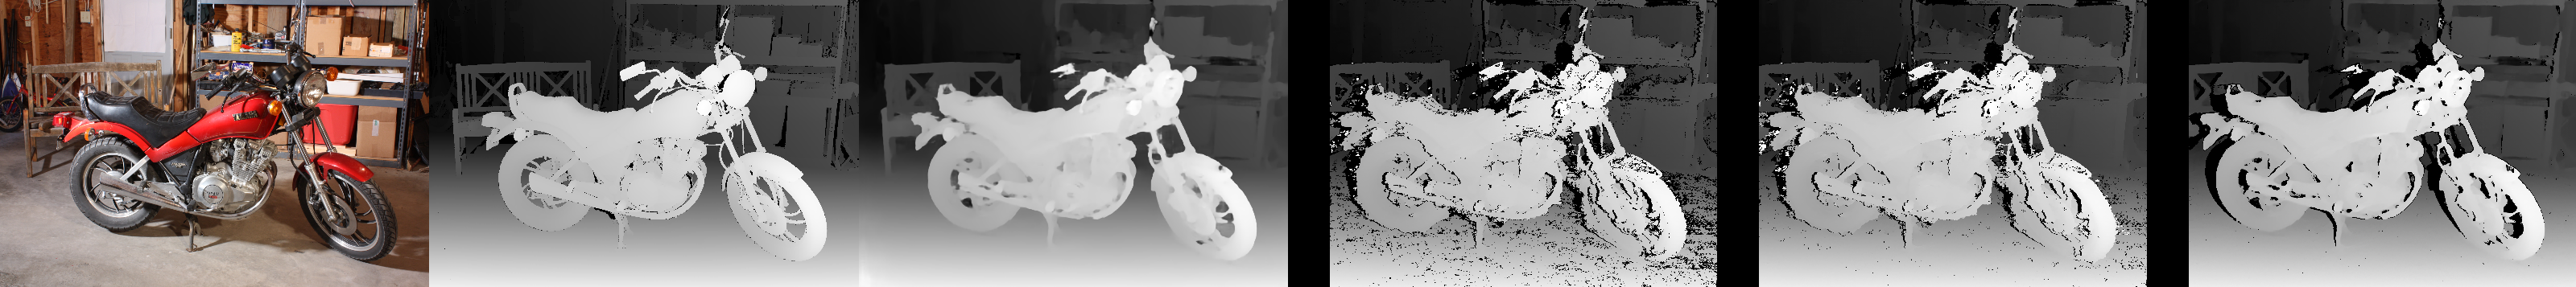
Motorcycle, true disparity, PSMNU (up-sampled), SGBM, SGBMUR, SGBMP.
MotorcycleE, GTC 86%, disparity range 1-288 pixels
| Method | Bad1.0 | invalid | avgErr | stdErr |
|---|---|---|---|---|
| PSMNU | 30.99 | (6.28) | 3.20 | 12.21 |
| SGBM | 17.28 | 31.93 | 8.38 | 29.30 |
| SGBMUR | 23.83 | 21.40 | 13.16 | 37.46 |
| SGBMP | 34.59 | 8.93 | 2.30 | 8.62 |
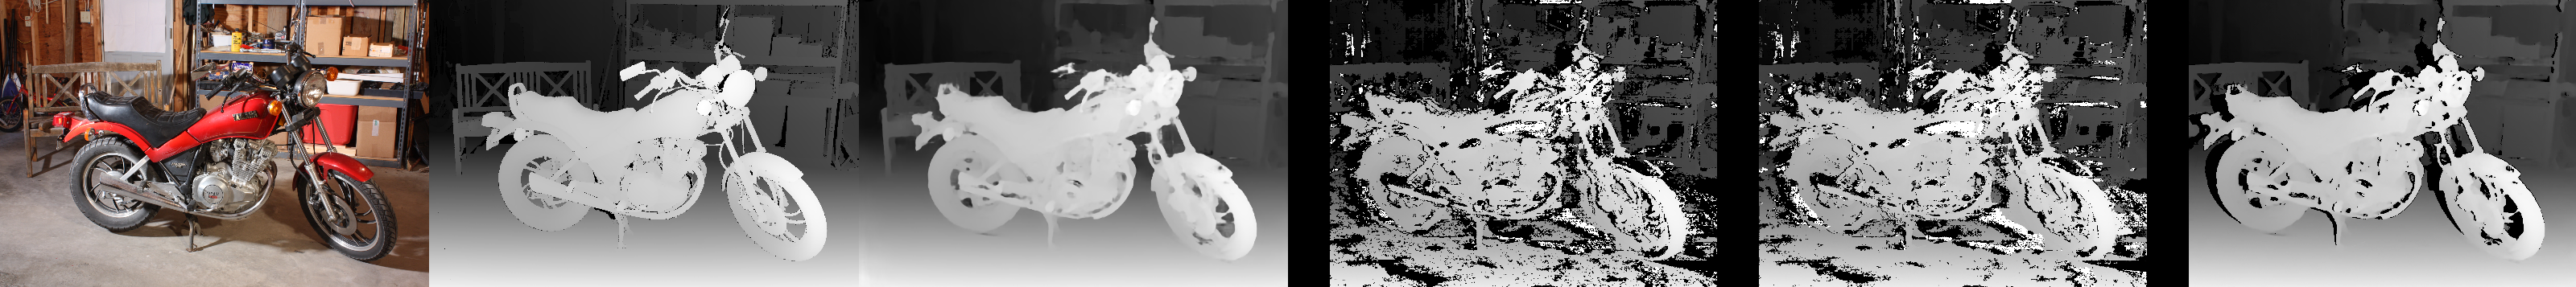
MotorcycleE, true disparity, PSMNU (up-sampled), SGBM, SGBMUR, SGBMP.
Piano, GTC 86%, disparity range 1-272 pixels
| Method | Bad1.0 | invalid | avgErr | stdErr |
|---|---|---|---|---|
| PSMNU | 30.75 | (4.49) | 3.09 | 12.99 |
| SGBM | 25.78 | 19.59 | 4.09 | 9.51 |
| SGBMUR | 34.30 | 9.23 | 5.31 | 11.27 |
| SGBMP | 35.90 | 5.21 | 3.04 | 12.66 |
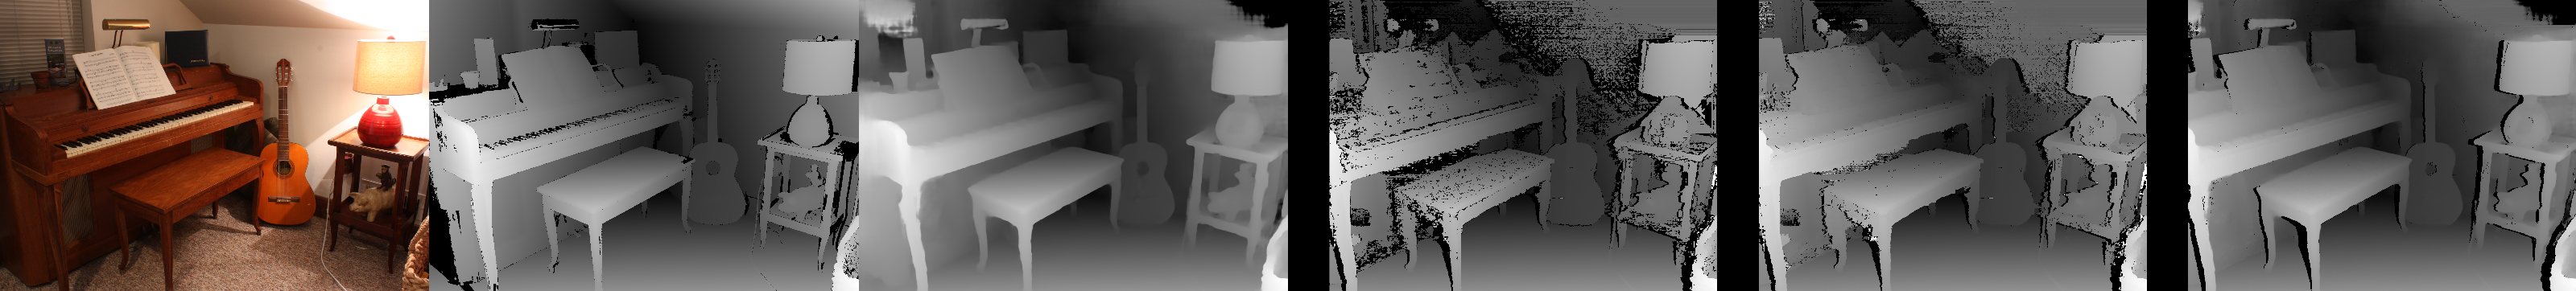
Piano, true disparity, PSMNU (up-sampled), SGBM, SGBMUR, SGBMP.
PianoL, GTC 86%, disparity range 1-272 pixels
| Method | Bad1.0 | invalid | avgErr | stdErr |
|---|---|---|---|---|
| PSMNU | 59.32 | (4.49) | 14.56 | 29.67 |
| SGBM | 21.44 | 44.60 | 25.01 | 52.33 |
| SGBMUR | 35.69 | 28.18 | 34.76 | 57.11 |
| SGBMP | 55.32 | 10.87 | 11.92 | 26.49 |
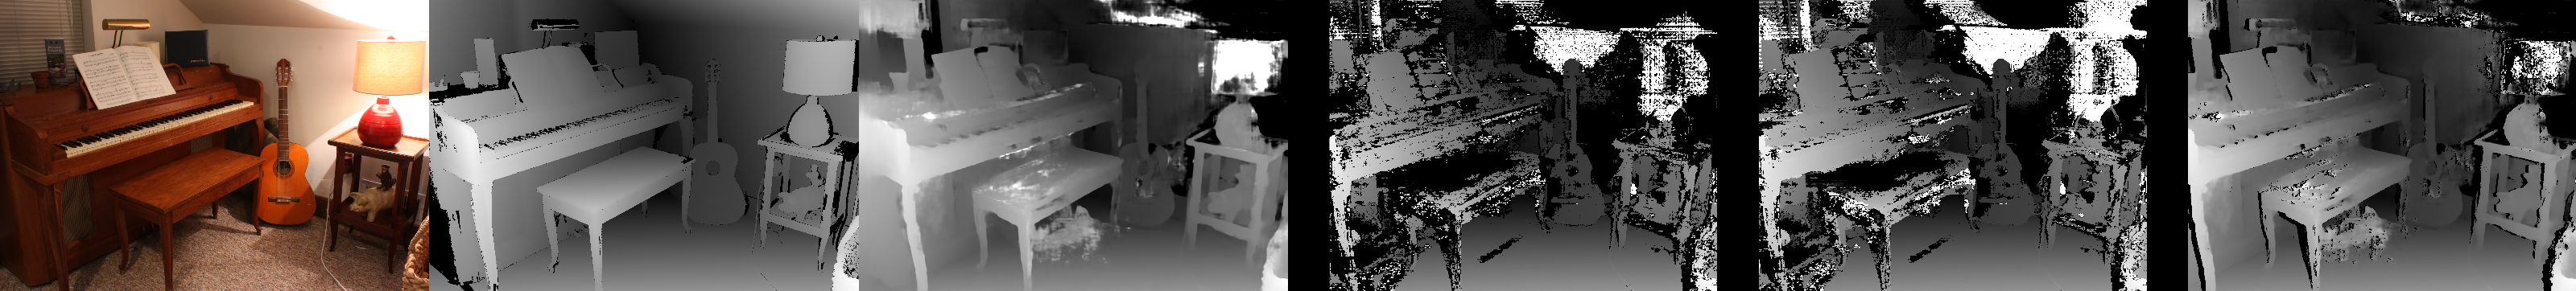
PianoL, true disparity, PSMNU (up-sampled), SGBM, SGBMUR, SGBMP.
Pipes, GTC 78.6%, disparity range 1-304 pixels
| Method | Bad1.0 | invalid | avgErr | stdErr |
|---|---|---|---|---|
| PSMNU | 27.92 | (5.23) | 3.75 | 13.81 |
| SGBM | 13.46 | 13.94 | 3.43 | 16.71 |
| SGBMUR | 16.80 | 9.45 | 4.26 | 18.41 |
| SGBMP | 21.54 | 8.37 | 2.44 | 10.84 |
Pipes, true disparity, PSMNU (up-sampled), SGBM, SGBMUR, SGBMP.
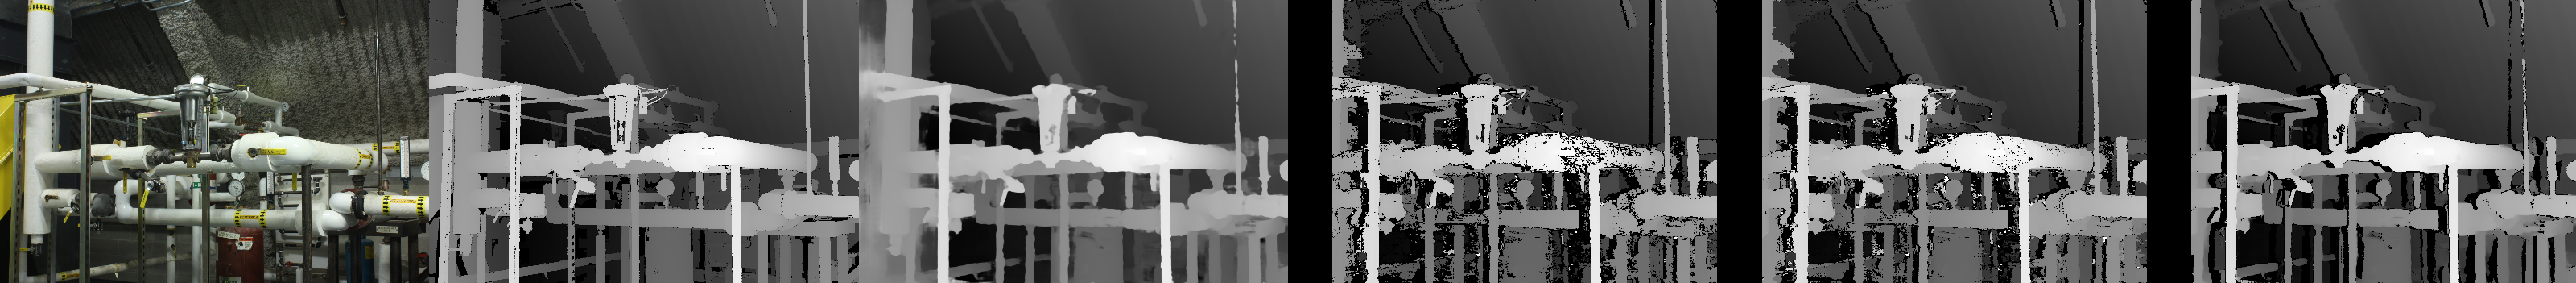
Playroom, GTC 79.9%, disparity range 1-336 pixels
| Method | Bad1.0 | invalid | avgErr | stdErr |
|---|---|---|---|---|
| PSMNU | 42.08 | (4.55) | 4.03 | 12.46 |
| SGBM | 23.62 | 31.89 | 5.05 | 16.27 |
| SGBMUR | 36.41 | 16.17 | 7.42 | 20.28 |
| SGBMP | 42.56 | 6.87 | 3.33 | 10.48 |
Playroom, true disparity, PSMNU (up-sampled), SGBM, SGBMUR, SGBMP.
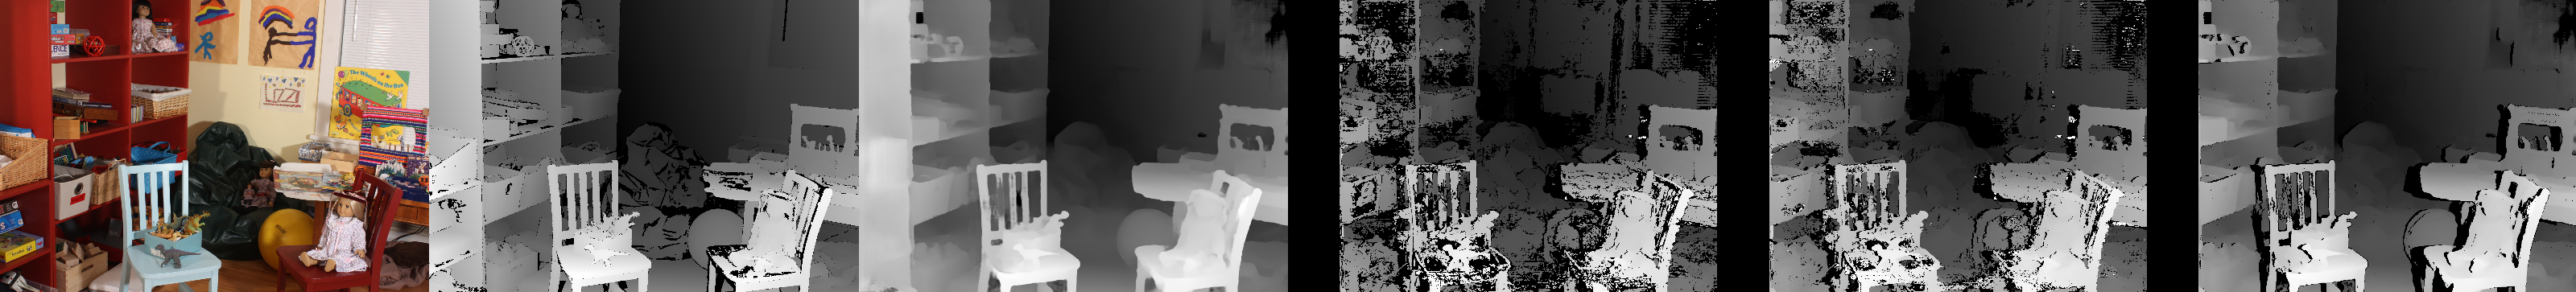
Playtable, GTC 86%, disparity range 1-304 pixels
| Method | Bad1.0 | invalid | avgErr | stdErr |
|---|---|---|---|---|
| PSMNU | 50.96 | (6.54) | 13.72 | 31.52 |
| SGBM | 31.39 | 28.35 | 10.52 | 28.23 |
| SGBMUR | 41.49 | 15.61 | 10.85 | 27.61 |
| SGBMP | 42.41 | 10.85 | 7.13 | 19.99 |
Playtable, true disparity, PSMNU (up-sampled), SGBM, SGBMUR, SGBMP.
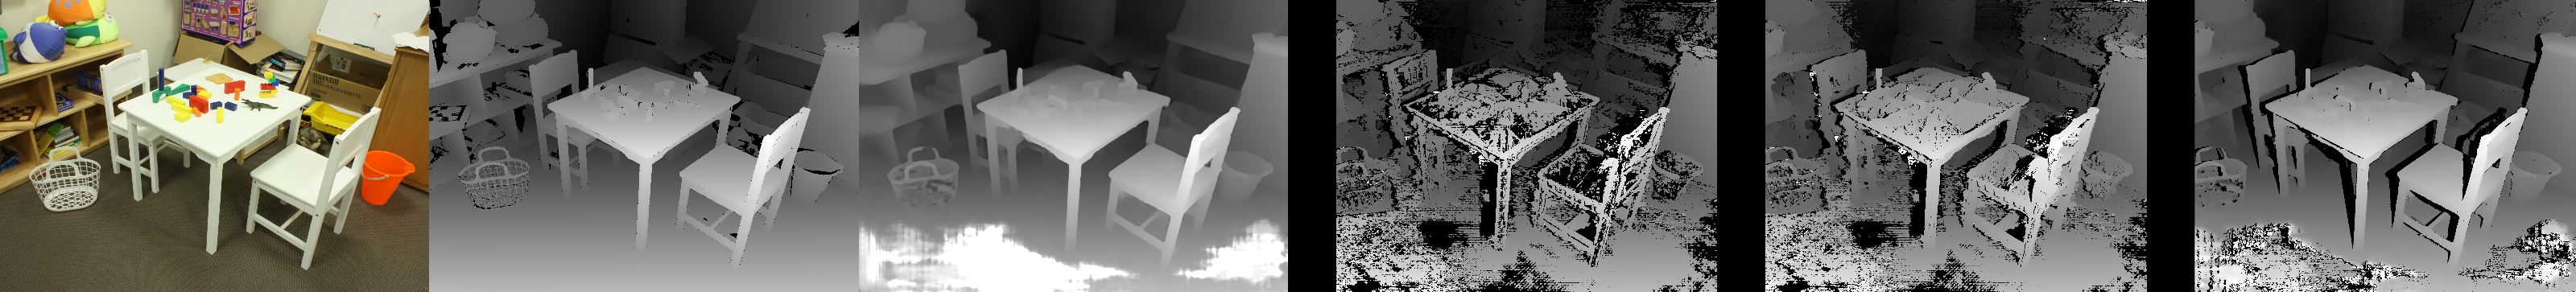
PlaytableP, GTC 86.2, disparity range 1-304 pixels
| Method | Bad1.0 | invalid | avgErr | stdErr |
|---|---|---|---|---|
| PSMNU | 38.00 | (6.53) | 7.83 | 22.77 |
| SGBM | 17.46 | 20.79 | 2.15 | 7.30 |
| SGBMUR | 25.57 | 10.75 | 2.78 | 8.31 |
| SGBMP | 25.01 | 8.65 | 1.68 | 5.19 |
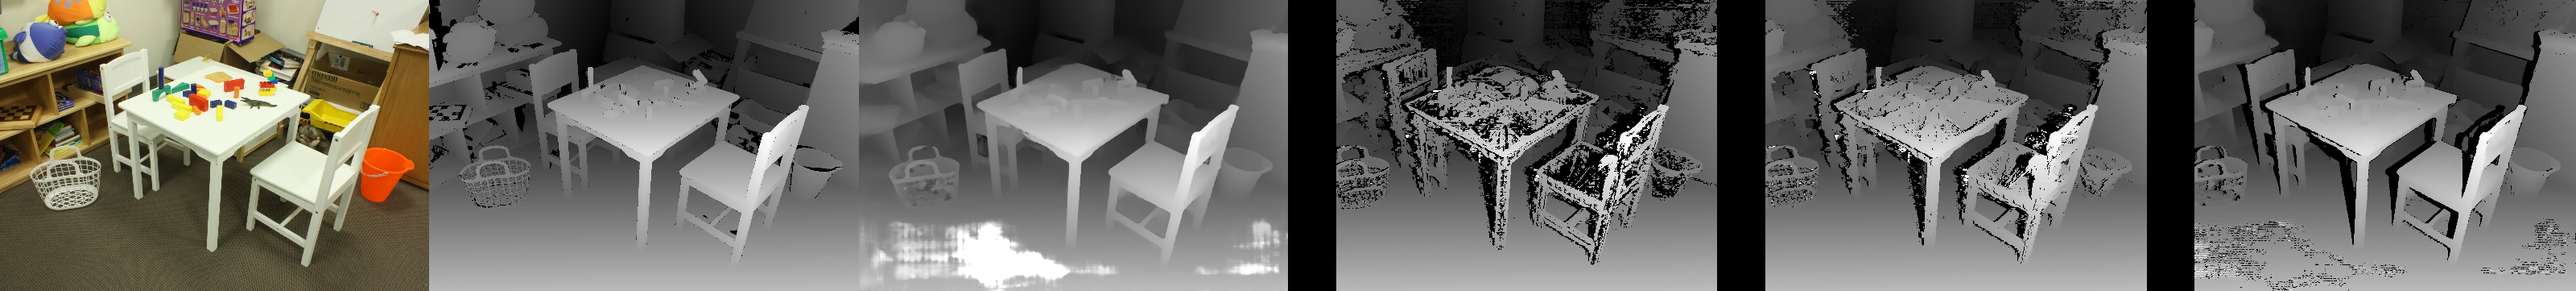
PlaytableP, true disparity, PSMNU (up-sampled), SGBM, SGBMUR, SGBMP.
Recycle, GTC 90.4%, disparity range 1-272 pixels
| Method | Bad1.0 | invalid | avgErr | stdErr |
|---|---|---|---|---|
| PSMNU | 29.38 | (7.49) | 2.51 | 10.01 |
| SGBM | 26.97 | 25.73 | 2.31 | 8.33 |
| SGBMUR | 36.58 | 13.40 | 3.54 | 11.73 |
| SGBMP | 37.72 | 8.57 | 2.43 | 9.06 |
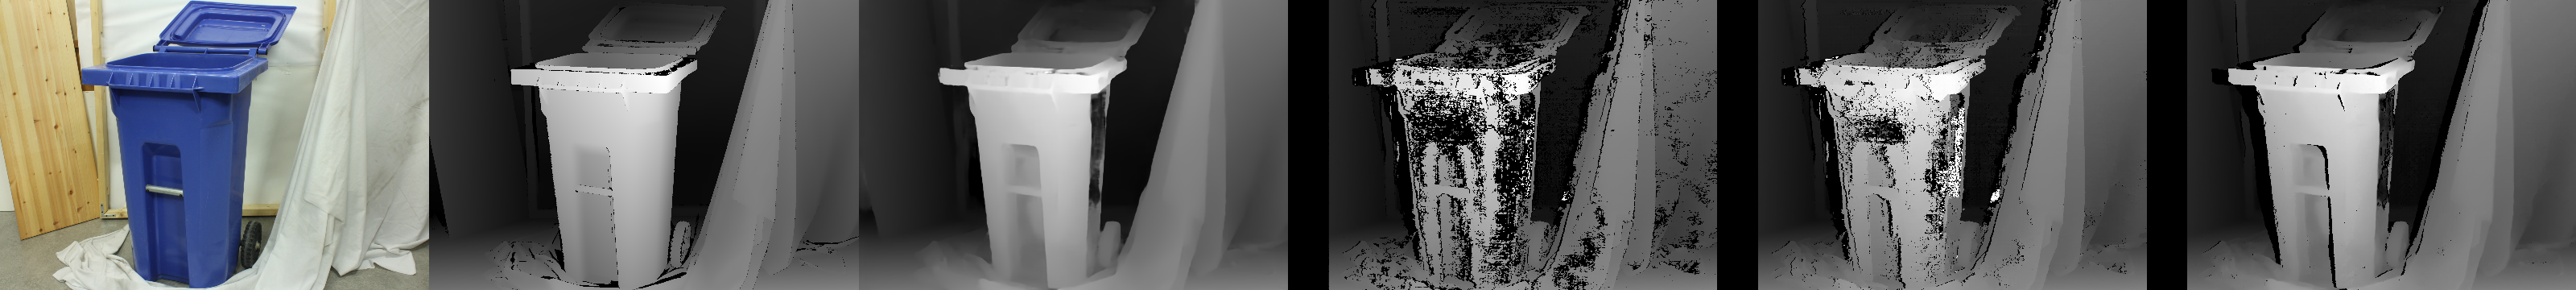
Recycle, true disparity, PSMNU (up-sampled), SGBM, SGBMUR, SGBMP.
Shelves, GTC 82.8%, disparity range 1-240 pixels
| Method | Bad1.0 | invalid | avgErr | stdErr |
|---|---|---|---|---|
| PSMNU | 61.72 | (5.94) | 4.86 | 12.34 |
| SGBM | 25.96 | 35.95 | 5.80 | 14.97 |
| SGBMUR | 42.90 | 17.69 | 8.31 | 17.01 |
| SGBMP | 50.12 | 6.91 | 4.00 | 9.20 |
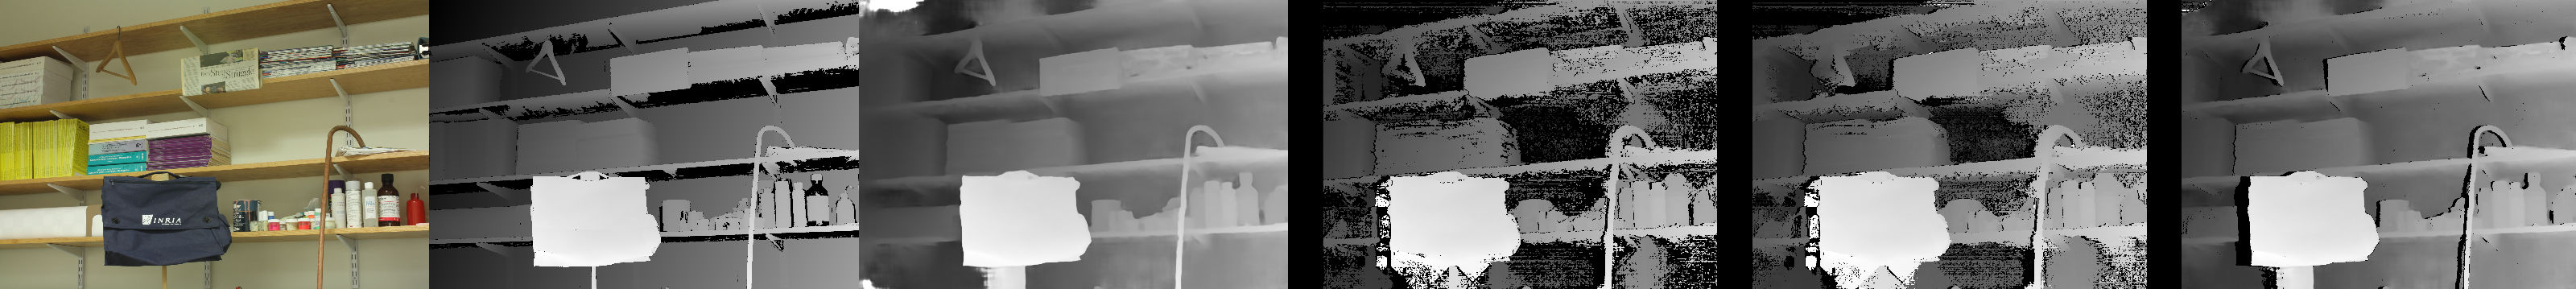
Shelves, true disparity, PSMNU (up-sampled), SGBM, SGBMUR, SGBMP.
Teddy, GTC 86.8%, disparity range 1-256 pixels
| Method | Bad1.0 | invalid | avgErr | stdErr |
|---|---|---|---|---|
| PSMNU | 9.78 | (7.97) | 1.19 | 4.17 |
| SGBM | 7.94 | 13.51 | 1.38 | 8.37 |
| SGBMUR | 9.92 | 10.51 | 1.82 | 10.83 |
| SGBMP | 10.85 | 8.74 | 1.12 | 3.49 |
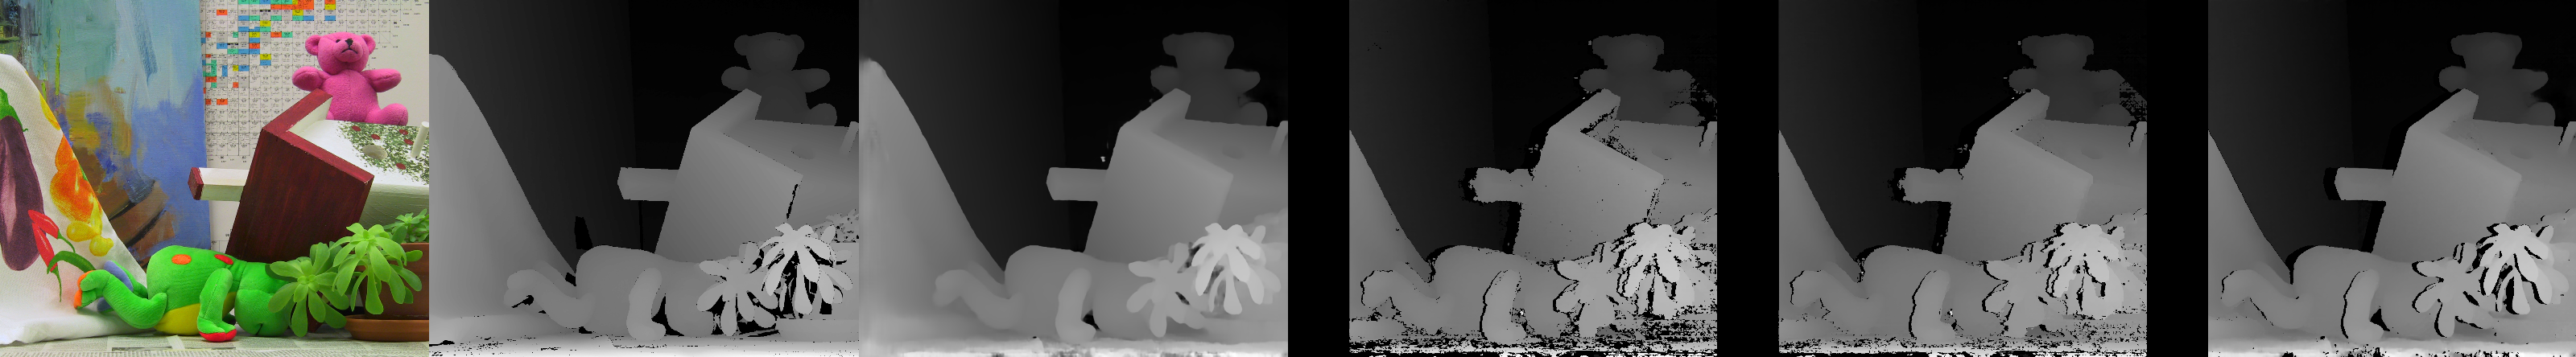
Teddy, true disparity, PSMNU (up-sampled), SGBM, SGBMUR, SGBMP.
Vintage, GTC 88.2%, disparity range 1-768 pixels
| Method | Bad1.0 | invalid | avgErr | stdErr |
|---|---|---|---|---|
| PSMNU | 37.54 | (23.09) | 8.33 | 27.43 |
| SGBM | 23.57 | 45.02 | 5.72 | 14.16 |
| SGBMUR | 36.36 | 29.49 | 7.91 | 21.57 |
| SGBMP | 33.88 | 24.90 | 6.48 | 20.49 |
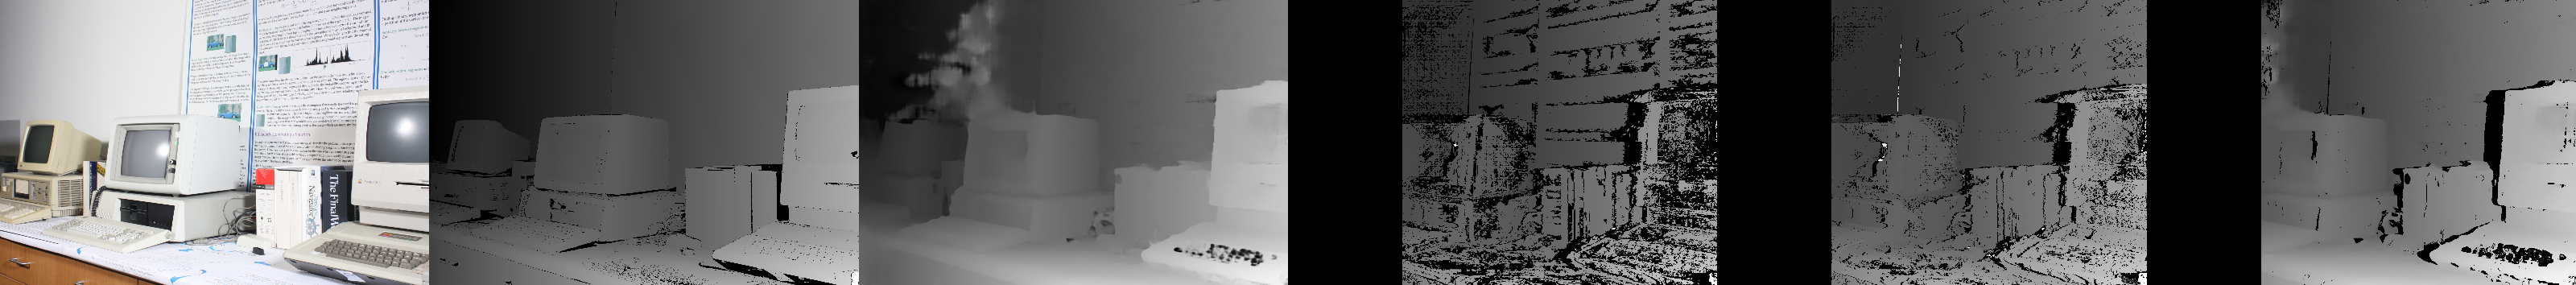
Vintage, true disparity, PSMNU (up-sampled), SGBM, SGBMUR, SGBMP.
2 Other comparisons
Here we provide ohter comparisons in detial on vairous public stereo datasets.
2.1 Evaluation of SGBMP on the Middlebury Evaluation V3 dataset
First of all, we provide the comparison on the Middlebury Evaluation V3 dataset. There are some comments on our methods.
- As described in the paper, in the current work, PSMNU works with a resolution of 768x1024. All the Middlebury images are first down-sampled to this resolution and then the disparity results are up-sampled back to their original full resolutions. The comparison is done with the up-sampled results.
- We train PSMNU on the Scene Flow dataset (Flyingthings3D and Monkaa). No data augmentation is applied. No fine-tune is applied for the Middlebury dataset. No Middlebury data appears in the training set.
- SGBMP works with full-resolution images and produces full-resolution disparity results.
- SGBMP is designed to work with our 4K resolution stereo images. The parameters of SGMBP are not tuned to achieve higher performance on any specific public dataset.
The results on Middlebury Evaluation V3 are submitted to the offical website of the Middlebury dataset. The name of the submission is SGBMP. Compared with other state-of-the-art methods that work with full resolution images, we do not have the top performance, partially because we did not tune the method for the Middlebury dataset.
On this dataset, we show SGMP does improve the performance of PSMNU and has better performance than the original SGBM method which also has the ability to operate on our 4K images. To the authors’ knowledge, no deep-learning methods operate 4K images directly. We are exploring the possibility to bring learning-based and non-learning-based methods together for high-resolution stereo reconstruction.
2.2 Evaluation of PSMNU on the Scene Flow dataset
The performance of SGBMP heavily depends on PSMNU which produces the initial disparity and uncertainty estimation on down-sampled images. To better compare the performance of PSMNU and understand its characteristics, we provide the evaluation results of PSMNU on the testing set of the Scene Flow dataset.
PSMNU is trained on the Scene Flow dataset1 (Flyingthings3D and Monkaa), it is expected that PSMNU performs well on the test set. We also have some comments first.
- The testing set is NOT in the training set.
- We only trained the model for a small number of epoch (5 epochs in the paper).
- No learning rate schedule is used.
- Due to the requirement of PSMNU, which is a modified version of PSMNet2, the dimensions of the images have to be dividable by 32. During the evaluation, we first resize the images to the closest dimension dividable by 32, then PSMNU performs disparity estimation. The disparity is then resized back to the original dimension.
- The test set of Scene Flow dataset has 4370 pairs of stereo images with true disparity maps. However, some of the test cases have extremely closed-up objects, resulting in very large disparity values. These cases are not suitable for evaluation. Following the treatment adopted by other researchers, we filter out the test cases which have their disparity larger than 300 on more than 25% of the total pixels3 4.
- We compute the end-point-error (EPE) on all the pixels with a ground truth disparity less than or equal to 256 (similar to PSMNet2). Then the total EPE over all these pixels of all the filtered test cases is summed and the average EPE is calculated.
The evaluation shows an average EPE of 1.49 pixel over 4349 filtered cases (with 21 cases filtered out). This EPE is higher than the original PSMNet because we have to compromise for the uncertainty estimation. As discussed in the paper, the uncertainty value works as a weight factor of the pixel-wise disparity error. For pixels tend to have a large error, the uncertainty attenuates the loss function by a larger uncertainty value.
A comparison between other deep-learning methods on the Scene Flow dataset is listed in the following table.
| EPE | # of epochs | Scene Flow dataset components | |
|---|---|---|---|
| CSPN5 | 0.78 | 10 | FlyingThings3D + Monkaa + Driving |
| DeepPruner6 | 0.86 | 64 | FlyingThings3D + Monkaa + Driving |
| SSPCV-Net7 | 0.87 | 40 | FlyingThings3D + Monkaa + Driving |
| PSMNet2 | 1.09 | 10 | FlyingThings3D + Monkaa + Driving |
| EdgeStereo8 | 1.11 | ~33 | FlyingThings3D + Monkaa + Driving |
| CRL4 | 1.32 | >10 | FlyingThings3D |
| iResNet3 | 1.40 | ~36 | FlyingThings3D + Monkaa + Driving |
| PSMNU (Ours) | 1.49 | 5 | FlyingThings3D + Monkaa |
| DispNetC1 | 1.68 | >20 | FlyingThings3D |
| GCNet9 | 2.51 | ~7 | FlyingThings3D + Monkaa + Driving |
2.3 Evaluation of PSMNU on KITTI datasets
KITTI datasets have 2 separate versions, the 2012 and 2015 sets. We also have additional comments:
- PSMNU has not been exposed to any kind of training data that is similar to a self-driving scenario. Scene Flow dataset does provide a similar set (the Driving set) but we did not use it.
- We did not submit the result to the KITTI website, the evaluations are performed locally on the “training set” with the development kit provided by KITTI. The kit reports average EPE on non-occluded and all ground truth pixels.
- For KITTI 2012, we only use the grayscale images. For KITTI 2015, which only provides color images, we convert the color images into grayscale ones.
- Images of the KITTI dataset have different dimensions, during the evaluation, we first resize the input images to 352x1216 (closest size to the original dimension dividable by 32). Then the disparity prediction is resized back to the original image size. Evaluations are performed on the original size.
Without any training data which covers the self-driving scenario, PSMNU achieves the average EPE values listed in the following table. Readers are encouraged to check out the performance of other methods listed on the KITTI 2012 and 2015 webpages.
| Dataset | 2012 | 2015 | ||||||
|---|---|---|---|---|---|---|---|---|
| Metrics | 3-pix noc % | EPE noc | 3-pix occ % | EPE occ | 3-pix noc % | EPE noc | 3-pix occ % | EPE occ |
| PSMNU | 6.04 | 1.15 | 6.93 | 1.37 | 6.73 | 1.65 | 6.98 | 1.69 |
References
-
Mayer, Nikolaus, Eddy Ilg, Philip Hausser, Philipp Fischer, Daniel Cremers, Alexey Dosovitskiy, and Thomas Brox. “A large dataset to train convolutional networks for disparity, optical flow, and scene flow estimation.” In Proceedings of the IEEE Conference on Computer Vision and Pattern Recognition, pp. 4040-4048. 2016. ↩ ↩2
-
Chang, Jia-Ren, and Yong-Sheng Chen. “Pyramid stereo matching network.” In Proceedings of the IEEE Conference on Computer Vision and Pattern Recognition, pp. 5410-5418. 2018. ↩ ↩2 ↩3
-
Liang, Zhengfa, Yiliu Feng, Yulan Guo, Hengzhu Liu, Wei Chen, Linbo Qiao, Li Zhou, and Jianfeng Zhang. “Learning for disparity estimation through feature constancy.” In Proceedings of the IEEE Conference on Computer Vision and Pattern Recognition, pp. 2811-2820. 2018. ↩ ↩2
-
Pang, Jiahao, Wenxiu Sun, Jimmy SJ Ren, Chengxi Yang, and Qiong Yan. “Cascade residual learning: A two-stage convolutional neural network for stereo matching.” In Proceedings of the IEEE International Conference on Computer Vision Workshops, pp. 887-895. 2017. ↩ ↩2
-
Cheng, Xinjing, Peng Wang, and Ruigang Yang. “Learning Depth with Convolutional Spatial Propagation Network.” IEEE transactions on pattern analysis and machine intelligence (2019). ↩
-
Duggal, Shivam, Shenlong Wang, Wei-Chiu Ma, Rui Hu, and Raquel Urtasun. “DeepPruner: Learning Efficient Stereo Matching via Differentiable PatchMatch.” In Proceedings of the IEEE International Conference on Computer Vision, pp. 4384-4393. 2019. ↩
-
Wu, Zhenyao, Xinyi Wu, Xiaoping Zhang, Song Wang, and Lili Ju. “Semantic Stereo Matching with Pyramid Cost Volumes.” In Proceedings of the IEEE International Conference on Computer Vision, pp. 7484-7493. 2019. ↩
-
Song, Xiao, Xu Zhao, Hanwen Hu, and Liangji Fang. “Edgestereo: A context integrated residual pyramid network for stereo matching.” In Asian Conference on Computer Vision, pp. 20-35. Springer, Cham, 2018. ↩
-
Kendall, Alex, Hayk Martirosyan, Saumitro Dasgupta, Peter Henry, Ryan Kennedy, Abraham Bachrach, and Adam Bry. “End-to-end learning of geometry and context for deep stereo regression.” In Proceedings of the IEEE International Conference on Computer Vision, pp. 66-75. 2017. ↩