MATLAB: Plot Dynamic Trajectory
Matlab provides a function, comet, to dynamically plot a trajectory. But back to the days in 2013, I was not satisfied with this function since it leaves the all the history of a dynamic trajectory on the figure. What I was seeking in mind is a function that plots a fixed mount of data from the trajectory and the user can only see a portion of the trajectory on the screen. And the trajectory moves like a snake.
To do this I checkout the source codes of comet and composed my own version based on the official one. The function is called newcomet. And the source code is here.
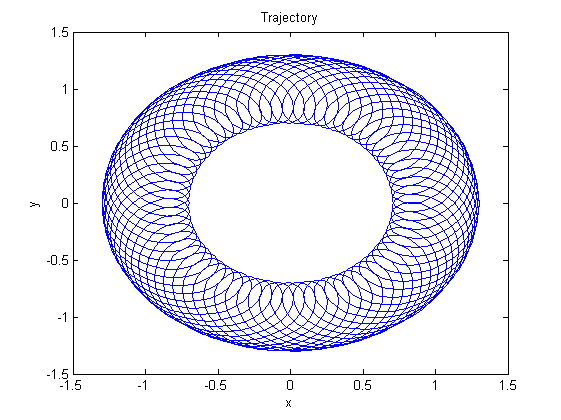
The following is the trajectory of its full time history.
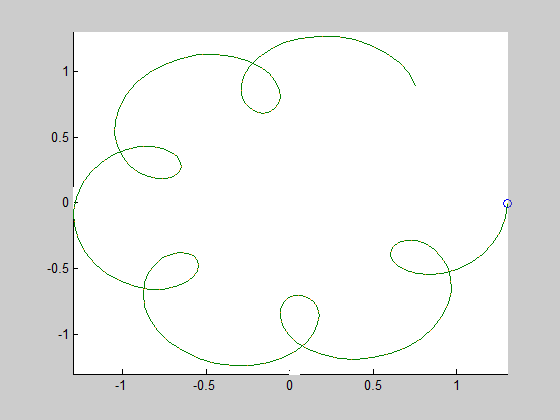
The following is the snapshot of newcomet on the fly.
The syntax of newcomet is the same with comet. However, if you supply a third argument, which is supposed to be an integer larger than 1, to newcomet, newcomet draws the trajectory with the length equals to this argument.
The script producing the above two figures is here. Enjoy!